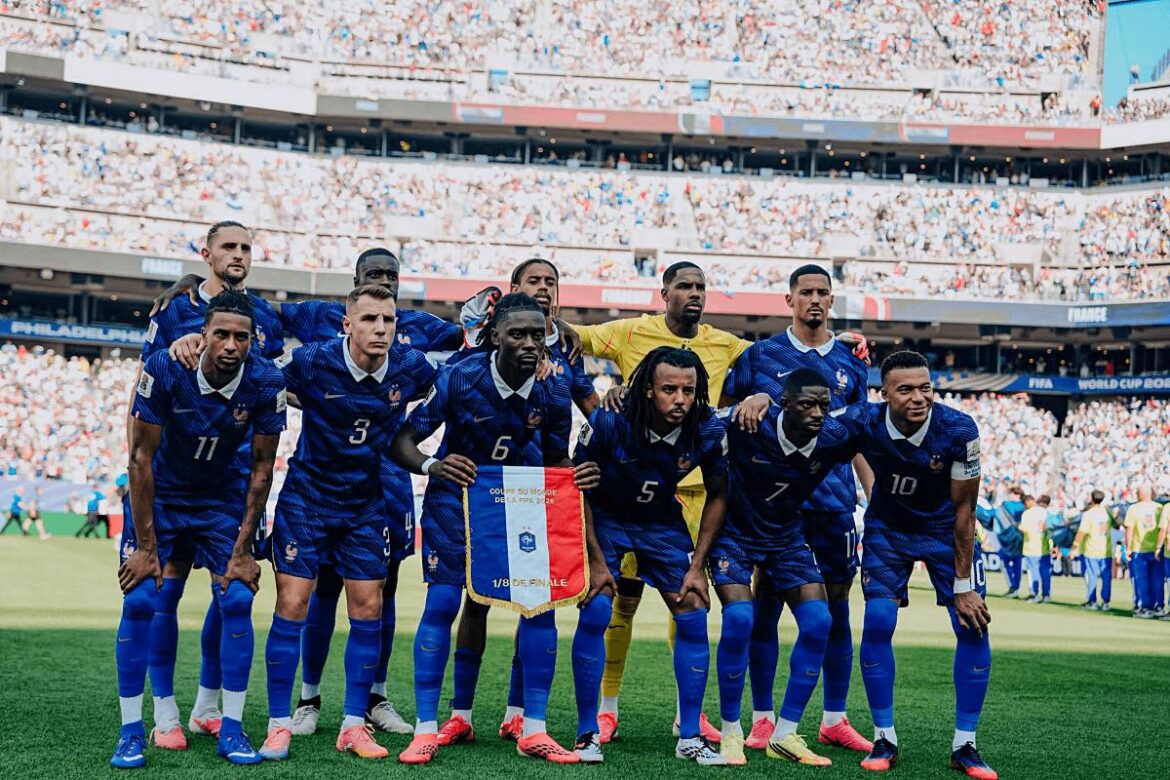
🇫🇷 France topped the tournament in total xG, generating 16.86 expected goals across eight matches—an average of 2.11 per game. Spain (15.54) finished second and Argentina (14.73) third, with both sides eventually meeting in the final.
🇧🇷 The biggest surprise, however, came from Brazil. They ranked third in xG per match (1.85)—slightly ahead of finalists Argentina (1.84). The catch? Brazil played only five matches, having been eliminated in the Round of 16. The same applies to Colombia (1.80), which also exited the tournament early.
⚡️ The lesson is clear: creating high-quality chances (xG) alone does not guarantee success. A team can generate better scoring opportunities per match than the tournament finalists and still be knocked out early due to inconsistency, poor finishing, or defensive weaknesses.
🎯 Betting takeaway: don’t confuse a team’s high xG in individual matches with long-term tournament reliability. This is especially important when evaluating teams with short knockout runs—one bad performance can erase everything, no matter how impressive their attacking numbers looked beforehand.